Exam Statistics Formula Sheet, Manual
| Mean | Sample: |
Population: |
|
|---|---|---|---|
| Weighted Mean | |||
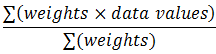 |
|||
| Median | If N is odd:
|
If N is even:
|
|
| Mode | |||
| Range |
|
||
| Class Width |
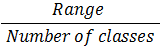
|
||
| Variance | Sample: 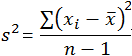
|
Population: 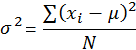 |
|
| Standard Deviation (SD) | |||
| Sample: |
Population: |
||
| Skewness |
|
||
| Coefficient of Variation | |||
| Sample: |
Population: |
||
| Grouped Data |
Weighted Mean: 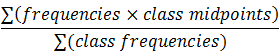 Median: Class with middle frequency: Variance: 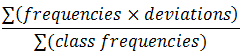 Where deviations = Population is same except divide by n, instead of n-1. SD: |
||
| Chebyshev | Where SD = number of standard deviations |
||
| Percentile | Round up if decimal; average if whole. |
||
| IQR, Outliers | Interquartile Range = Q3 − Q1 |
||
|
Upper Outlier: Q3 + 1.5(IQR) |
|||
|
Lower Outlier: Q1 − 1.5(IQR) |
|||
| Probability | P(A) P(A or B) |
||
|
Independent: |
|||
|
P(A and B) |
|||
|
Dependent: |
|||
|
P(A and B) |
|||
|
Conditional: |
|||
|
P(A | B) |
|||
| Bayes' Rule: | |||
|
P(A | B) |
|||
|
Where or = |
|||
| Permutation | |||
| Combination | 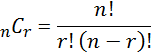 |
||
| Discrete Distributions | |||
| Expected Value: Variance: SD: |
|||
| Binomial Distributions | ||||
|---|---|---|---|---|
| Mean: | ||||
| Variance: | ||||
| SD: | ||||
| Probability: | ||||
| Normal Distributions | ||||
| Z Score: |
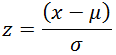
|
|||
| Probability: | Look up probabilities in "Areas Under the One-Tailed Standard Normal Curve" table. | |||
| Probability to Z: | Adjust probability (add or subtract .5) then look up z closest to adjusted probability. | |||
|
Probability to X: |
|
|||
| Sampling from Normal Distribution, Mean (Central Limit Theorem) | ||||
| Standard Error: |
|
|||
|
Probability: |
 |
|||
| Sampling from Normal Distribution, Proportion | ||||
|
Validation:
|
||||
| Standard Error: |
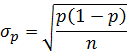
|
|||
| Z score: |
|
|||
|
Probability: |
Look up probabilities in "Areas Under the One-Tailed Standard Normal Curve" table. |
|||
| Confidence Intervals, Mean | ||||
| Alpha: |
|
|||
| Margin of Error: |
|
|||
|
Margin of Error: Interval: |
|
|||
| Confidence Intervals, Proportion | ||||
|
Margin of Error: Interval: |
|
|||
| Sample Size, Mean | ||||
|
|
||||
| Sample Size, Proportion | ||||
|
Validation:
|
||||
| Hypothesis Tests | Standard Error: | Test Statistic: | ||
| Mean: |  |
|||
| Proportion: | 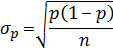 |
 |
||
| Small Sample: |  |
|||
| P-Value: | |
|||
| Regression Analysis | ||||
C. of Correlation:
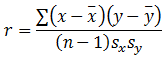
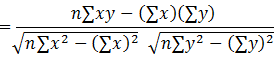
|
||||
| C. of Determination: |
|
|||
| Regression Equation: |
|
|||
| Slope: |
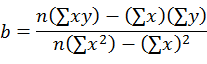 |
|||
| Y Intercept: |
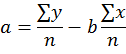 |
|||