
|
|
A seed to cultivate your mind. |
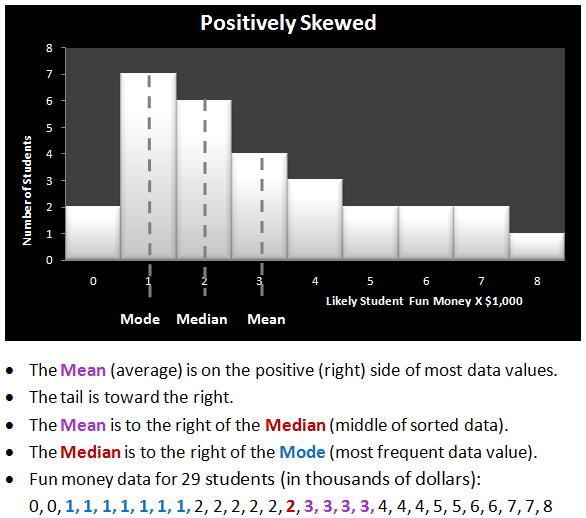
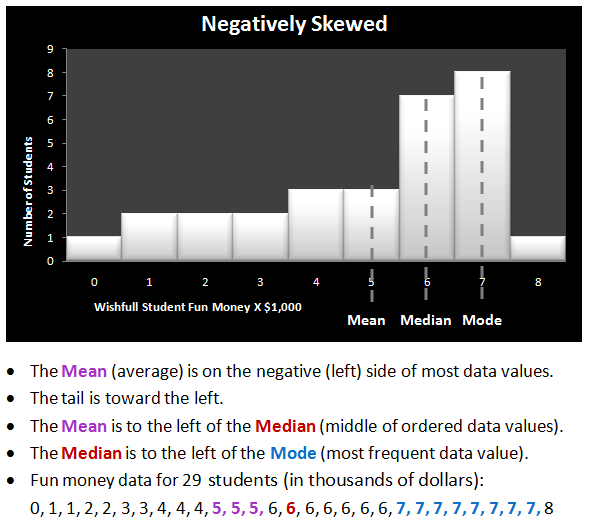
If you graph the data using a histogram or bar chart, does it look symmetrical or lop-sided? If your data has more extreme observations to one side of the centre, this long set of data on one side is called a long tail and is measured by the skewness calculation. If there is tail, which means more extreme values on the right, the skew value is positive. If the tail is on your left side when you look at the chart, this skew value is negative.
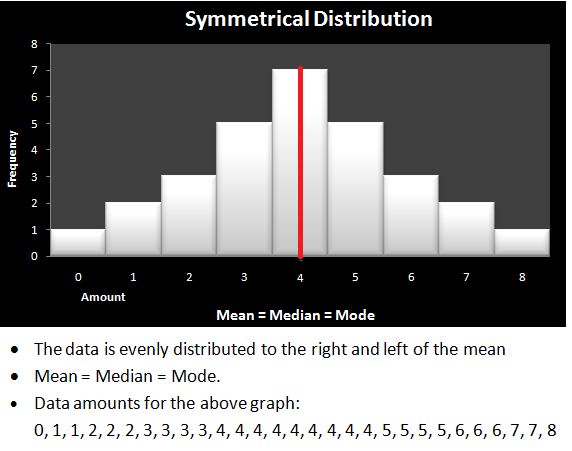
We can use a calculation called variance or standard deviation to see how much spread or variability is in the data, and the skew value tells us if the data is symmetrical. Normal distributions are symmetrical, and some calculations can be done with normal data distributions that are not suitable with other types of data distributions. Data that is perfectly symmetrical has a skew value of zero.
Positively Skewed: 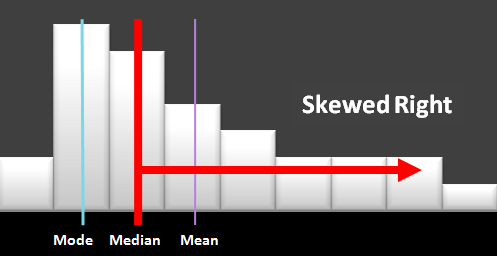
Negatively Skewed: 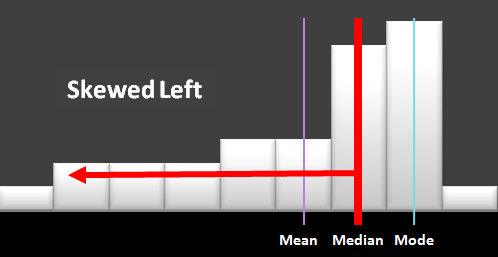
Symmetrical Distribution: 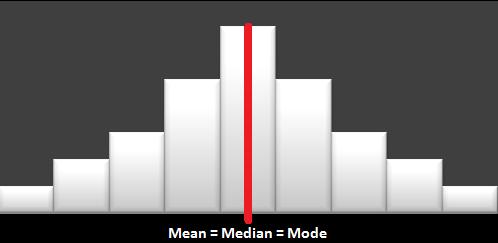
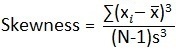
Where:
Assume you have data values of 1, 2, 3, 4, 5, 6, 7, 8, and 9 in cells A1 to A9.
In Excel, if your teacher accepts the Excel calculation: =SKEW(A1:A9).
If you want Excel to assist in the manual formula, you can get each value for the formula as follows.
In cell A10 for the mean: =AVERAGE(A1:A9)
In cell A11 for the median: =MEDIAN(A1:A9)
In cell A12 for sample standard deviation: =STDEV(A1:A9)
In cell A13 or the skew calculation: =3*(A10-A11)/A12
You should be aware that computer applications like Minitab or Excel use a different formula for calculating skewness than most books show for manual calculations. Check with your teacher to see which calculation is acceptable.
| Step 1: | Could calculate using Excel SKEW formula: =SKEW(A1:A9) Answer is 1.95 |
| Step 1: | =AVERAGE(A1:A9) = 16.44 = Mean =MEDIAN(A1:A9) = 5 = Median =STDEV(A1:A9) = 22.41 = Standard Deviation |
| Step 2: | =3*(Mean-Median)/ Standard Deviation = 3*(16.44 - 5) / 22.41 = 1.53 |
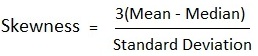
The skew formula uses the mean, median, and standard deviation calculations.
|
GrowingKnowing.com © 2010. All rights reserved. |
Last updated: September 20, 2023 |
|---|