Statistics Cheat Sheet
| Topic |
Formula/Description |
Example |
Excel
|
| Central Tendency: |
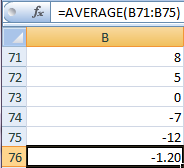
| Mean |
Sample: 
Population:  |
Given: 8, 5, 0, -7, -12
Mean = (8 + 5 + 0 + -7 + -12)/5
= -6/5 = -1.20 |
|
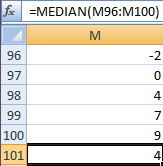
| Median |
Middle value in ordered data.
If number of values (N) is odd:
Median = 
|
Given ordered data: -2, 0, 4, 7, 9
(N + 1)/2 = (5 + 1)/2 = 6/2 = 3
Median = (the value in position 3) = 4
|
|
|
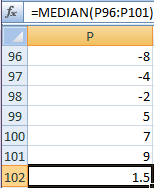
If N is even:
Average the middle 2 values.
| Given ordered data: -8, -4, -2, 5, 7, 9
N/2 = 6/2 = 3 so average the 3rd and 4th values.
Median = (-2 + 5)/2 = 3/2 = 1.5
|
|
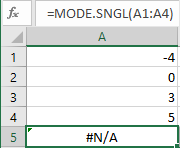
| Mode |
The data value with more repeats than any other data value.
|
Given: -4, 2, 0, 2, 3, 2, 3
Mode = 2
|
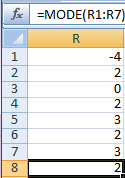
See WARNING below.
|
| No Mode |
All data values have the same number of repeats.
|
Given: -4, 0, 2, 3, 5
No Mode
|
|
| Bimodal |
Two data values are tied for the most number of repeats. |
Given: -4, 6, 1, 1, 2, 6, 1, 5, 6
Bimodal values = 1 and 6
|
WARNING, Excel Mode formula gives
you only one of the two bimodal values.
Best to sort data and count repeats.
|
| Multimodal |
More than two data values are tied for the most number of repeats. |
Given: -4, 0, -4, 0, 2, 3, 2, 5, 3
Multimodal values = -4, 0, 2 and 3
|
WARNING, Excel gives you only one
of the multimodal values. |
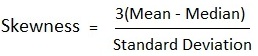
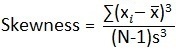
| Positive Skewness |
Most extreme data values are to the right side of centre.
Manual:
Excel:
 |
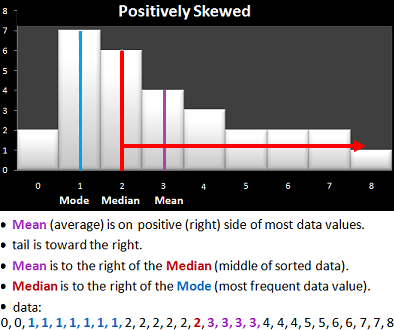
Skewness = 3(3 - 2) / 2.22 = 1.35
|
Mean: =AVERAGE(A1:A29) = 3
Median: =MEDIAN(A1:A29) = 2
Std.Dev: =STDEV(A1:A29) = 2.22
Skewness = 3*(3 - 2)/2.22 = 1.35
Using Excel to calculate with the "manual"
Skewness formula yields the same answer
as the manual calculation on the left.
Excel SKEW formula below has a different
answer. Ask your teacher which method
to use.
=SKEW(B121:B149)
= 0.736230686
|
| Negative Skewness |
Most extreme data values to left side of centre.
|
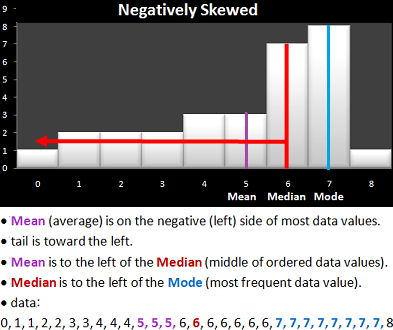 Skewness = 3(5 - 6) / 2.19 = -3 / 2.19 = -1.37
|
Mean: =AVERAGE(A1:A29) = 5
Median: =MEDIAN(A1:A29) = 6
Std.Dev: =STDEV(A1:A29) = 2.19
Skewness = 3*(5 - 6)/2.19 = -1.37
=SKEW(B121:B149)
= -0.983377
|
| Variability: |
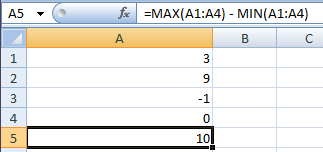
| Range |
Difference between largest & smallest values.
|
Given: 3, 9, -1, 0
Range = Maximum - Minimum = 9 - (-1) = 10 |
|
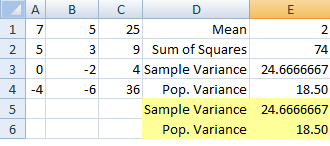
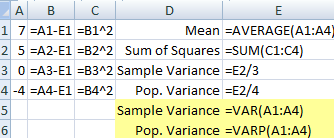
| Sample Variance |
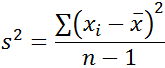 |
|
| Data |
xi - x̄ |
(xi - x̄)2 |
|
|
|
| 7 |
7 - 2 = 5 |
25 |
| 5 |
5 - 2 = 3 |
9 |
| 0 |
0 - 2 = -2 |
4 |
| -4 |
-4 - 2 = -6 |
36 |
| |
Total: |
74 |
| s2 = 74 / (4-1) = 74 / 3 = 24.6666667 |
|
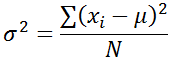
| Population Variance |
 |
|
| Data |
xi - x̄ |
(xi - x̄)2 |
|
|
|
| 7 |
7 - 2 = 5 |
25 |
| 5 |
5 - 2 = 3 |
9 |
| 0 |
0 - 2 = -2 |
4 |
| -4 |
-4 - 2 = -6 |
36 |
| |
Total: |
74 |
| σ2 = 74 / 4 = 74 / 4 = 18.50 |
Same as Above
|
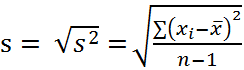
| Sample Standard Deviation |
 |
Given: Variance = 9
s = square root of 9 = 3
Given data: 7, 5, 0, -4
Calculate variance: s2 = 24.6666667
s = square root of 24.6666667 = 4.96655481
|
=stdev(A1:A4) |
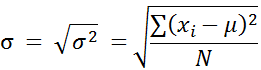
| Population Standard Deviation |
 |
Given data: 7, 5, 0, -4
Calculate variance: σ2 = 18.50
σ = square root of 18.50 = 4.30116263
|
=stdevp(A1:A4) |
| Sample Coefficient of Variation |
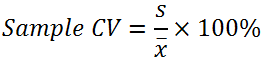
|
Given: mean = 80, s = 10
Sample CV = 10/80 X 100% = 12.5% |
|
| Population Coefficient of Variation |
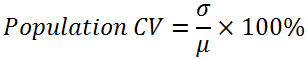
|
Given: mean = 75, σ = 5
Sample CV = 5/75 X 100% = 6.67% |
|
| Interquartile Range |
A Variability measure, but described below, under "Position".
|
|
|
| Empirical Rule |
68% within 1 standard deviations of mean
95% within 2 standard deviations of mean
99.7% within 3 std. deviations of mean
|
|
|
| Position: |
| Percentile |
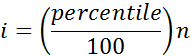
Where i is position in ordered data of "percentile" value.
If i is a decimal: round up
If i is a whole number: average i and i+1
|
Find the 25th percentile, given: 1, 3, 4, 4, 5
i = (25/100)5 = .25 x 5 = 1.25
i is a decimal so round up to 2
The value in position 2 is 3 so the 25th percentile is 3.
Find the 50th percentile, given: -8, -5, 3, 9
i = (50/100)4 = 2 which is a whole number,
so average the values at positions 2 & 3:
(-5 + 3)/2 = -2/2 = -1
-1 is the 50th percentile.
|
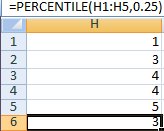
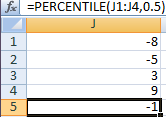
Use Excel percentile function only if your teacher agrees.
|
| Interquartile Range |
Q3 - Q1 |
Given sorted data: 2, 3, 4, 5, 6, 7, 8, 9, 10
Q3: i = 75/100(9) = 6.75 (round up to 7)
Data value at position 7 is 8
Q1: i = 25/100(9) = 2.25 (round up to 3)
Data value at position 3 is 4
Interquartile Range = Q3 - Q1 = 8 - 4 = 4
|
|
| Sample Z Score |
 |
Find z score for 50.
Given: mean = 100, standard deviation = 10
z score = (50 - 100) / 10 = -5
| =(A1-A2)/A3 where:
A1 = some data value
A2 = mean
A3 = standard deviation |
| Population Z Score |
 |
Find z score for 150.
Given: mean = 100, standard deviation = 25
z score = (150 - 100) / 25 = +2
|
Same as above. |
| Probability: |
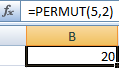
| Permutation |
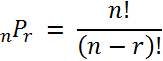 |
Pick 2 students out of 5; give one $5 & the other $500.
You choose permutation because order is important: $5 to Lee & $500 to Joe is different than $5 to Joe & $500 to Lee.

|
 |
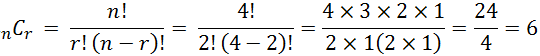
| Combination |
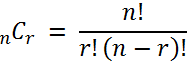 |
If you could choose 2 of the following 5 prizes: Roadster, Highlander Hybrid, MKS, GLK or cash. How many different pairs could be selected?
Order doesn't matter. (cash, MKS) is the same as (MKS, cash) to you, so use Combination.

|
=COMBIN(5,2)
= 10
|
|
|
How many ways could you can group 2 dogs out of collection of 4 dogs?
(Lassie,Rex) is the same as (Rex,Lassie), so use Combination:
|
=COMBIN(4,2)
= 6 |
| Discrete Probability: |
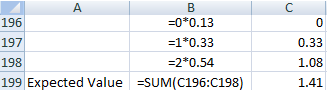
| Expected Value |
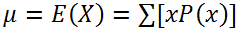
|
Given: x P(x)
0 .13
1 .33
2 .54
 |
|
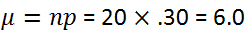
| Binomial Mean |

|
Given: N = 20, p = .30
 |
 |
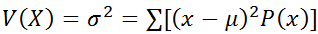
| Discrete Variance |
 |
| Given: X |
Probability |
| 0 |
.65 |
| 1 |
.10 |
| 2 |
.20 |
| 3 |
.05 |
= 0(.65) + 1(.10) + 2(.20) + 3(.05) = .65
= (0-.65)2.65 + (1-.65)2.1 + (2-.65)2.2 + (3-.65)2.05
= .4225(.65) + .1225(.10) + 1.8225(.20) + 5.5225(.05)
= .274625 + .01225 + .3645 + .276125
= .9275
|
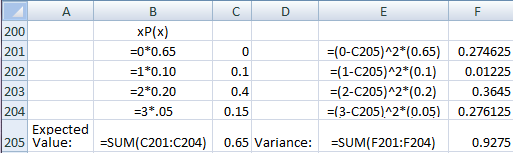
In the Excel images above, formula comments are shown to the left of each cell that contains a formula.
|
|
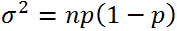 |
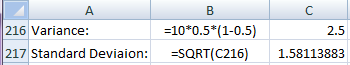
For a binomial distribution, with probability of .5 and sample size of 10, what is the variance?
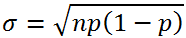
Variance = σ2 = np(1-p) = np(1-p) = 10(.5)(1 - .5) = 5(.5) = 2.5
|

|
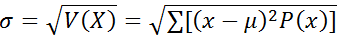
| Discrete Standard Deviation |
 |
| Given: X |
Probability |
| 0 |
.65 |
| 1 |
.10 |
| 2 |
.20 |
| 3 |
.05 |
= 0(.65) + 1(.10) + 2(.20) + 3(.05) = .65
= (0-.65)2.65 + (1-.65)2.1 + (2-.65)2.2 + (3-.65)2.05
= .4225(.65) + .1225(.10) + 1.8225(.20) + 5.5225(.05)
= .9275
Take the square root of the variance:
Standard deviation = σ = √.9275 = .963068
|
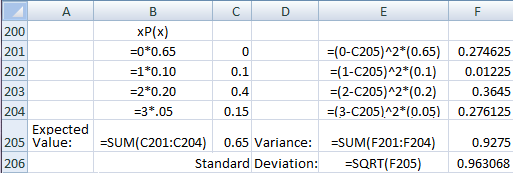
In the Excel image above, formula comments are shown to the left of each cell that contains a formula.
|
| Binomial Standard Deviation |
 |
For a binomial distribution, with probability of .5 and sample size of 10, what is the standard deviation?
Variance = σ2 = np(1-p) = np(1-p) = 10(.5)(1 - .5) = 5(.5) = 2.5
Standard deviation = σ = √2.5 = 1.58113883
|
|
| GrowingKnowing.com © 2010. All rights reserved.
|
Formula Comparisons (for population data)
| |
Univariate
|
Discrete |
Binomial |
| Mean |
|
|
|
| Variance |
|
|
|
| Standard Deviation |
|
|
|